

Chaitali Jawale Portfolio
September 20, 2019 2024-01-24 13:38Chaitali Jawale Portfolio
Chaitali Jawale
Data Science and ML Enthusiast
"Every evening, We store and organize data, and in the morning, We extract valuable insights!
what i love
I have a passion for using data to solve complex problems and make informed decisions.
A diverse range of projects covering data analysis, machine learning, natural language processing, computer vision, and more.
Decent experience in Python, SQL, Tableau, Power BI, TensorFlow, Keras, Azure Databricks, Machine Learning Computer Vision, NLP etc..
Published paper in Data Analysis and IOT Domain.
Technical & Interpersonal Skills
- Python:
- NumPy
- Pandas
- Scikit-learn
- TensorFlow
- PyTorch
- Keras
- Matplotlib
- Seaborn
- Plotly
- Flask
- Pyspark (Spark)
- Java
- Ruby
- C++
- R
- JavaScript
- Shell Scripting
- PHP
- Data Preprocessing
- Feature Engineering
- EDA (Exploratory Data Analysis)
- Statistical Analysis
- Data Wrangling
- Hypothesis Testing
- Data Cleaning
- Data Transformation
- Data Visualization
- Time Series Analysis
- ETL dataflow
- Matplotlib
- Seaborn
- Plotly
- Tableau
- Power BI
- Interactive Dashboards
- Storytelling with Data
- Infographics
- SVM (Support Vector Machines)
- Random Forest
- KNN (K-Nearest Neighbors)
- Decision Trees
- Naive Bayes
- Neural
Networks - Logistic Regression
- Gradient Boosting
- Dimensionality Reduction
- Correlation Analysis
SQL:
- Data Manipulation
- Joins
- Aggregations
- Subqueries
- Database Management
- Stored Procedures
- Views
- Transactions
MySQL
NoSQL
SQL Server
Can communicate with Stakeholders to document the findings and responsibilities using:
- MIRO Board
- Confluence
- JIRA Tickets
- Sprint Management
- Sentiment Analysis
- Text Classification
- Open AI platform
- Chatgpt – GPT-4
- DaVinci
- Text-DaVinci
- Git
- GitHub
- GitLab
- Azure Databricks
- VS Code
- PyCharm
- Anaconda
- JIRA
- Confluence
- MIRO
- Advanced MS Office Excel
- GCP
- AWS
- Microsoft Azure
1. Problem Solving :
- Troubleshooting
- Algorithm Design
- Optimization Techniques
- Debugging
- Pattern Recognition
- Creative Problem
- Solving
- Decision Making
- Analytical Thinking
- Critical Thinking
- Logical Reasoning
2. Teamwork & Collaboration:
- Cross-functional Collaboration
- Communication
- Agile Methodology
- Team Coordination
- Conflict
Resolution - Active Listening
- Knowledge Sharing
- Remote Collaboration
- JIRA ticket management
- Technology Agility
- Learning Mindset
- Research Skills
- Keeping up with Industry Trends
- Experimentation
- Self-Directed Learning
- Continuous Improvement
- Flexibility
- Openness to New Ideas
- Curiosity
Educational background
Academic Curve
Artificial Intelligence and Data Science
Jan 2022 - Aug 2023
Loyalist College in Toronto, ON
Majors
Statistical modelling and inference
Machine learning
Data visualization
Data Story Telling
Data warehousing
Business intelligence
Computer vision
Python
Mathematics for data science
Deep Learning
Natural Language Processing

Computer Science and Engineering
July 2015 - June 2019
MGM's JNEC, Aurangabad, India
Dr. BAMU University
Majors
Data Structures and Algorithms
Database Management System
Operating System
Computer Network
Agile Methodology
Object Oriented Programming
Image Processing
Internet of Things
Mathematics I, II, III, IV
Web Development
Android Development
"Experience is the best teacher."
Work experience

Apple, Toronto ON
Sept 2022 - Jan 2023 (5 Months)
Responsibilities
- (via. Teleperformance) Designed and constructed data pipelines for processing distributed data on a large scale(min row count 180K), particularly focused on Apple sales data during periods of November-December releases and new product launches.
- Performed Extract, Transform, and Load (ETL) operations by utilizing Apache DAG scripts (Airflow) to extract data from various sources and transform noisy data into valuable information within data storage systems.
- Possess expertise in data preprocessing, feature engineering, and model evaluation techniques tailored for text-based datasets, including reviews and ratings to better the streamline data process.
- Developed and deployed rule-based algorithms using Python to effectively identify KPI patterns and anomalies within customer data, leading to a comprehensive understanding of product sales trends and facilitating efficient fraud detection.
- Contributed in customer segmentation analysis to derive the impact of most correlated metrics.
- Created Microservices dedicated to serving real-time marketing data with model predictions and
- Designed user-friendly makefiles with a generic structure for effortless setup of both local and Docker environments.
- Modified Python functions to align with new business requirements and use cases specific to rule-based models.
- Collaborated extensively with cross-functional teams to comprehend problem statements and business requirements, and communicated solutions in a clear manner, ensuring understanding even among non-technical stakeholders.
- Implemented unit test function modules for each component, ensuring high code quality through the use of pytest.
- Contributed to the creation of Docker images, the management of Kubernetes clusters, and the enhancement of the development repository, thereby providing support for production and other development teams.

Atos Syntel, Pune, India
Nov 2019 – Dec 2021 (2 Years)
Responsibilities
- Collaborated with Finland-based energy production company "Fortum", focusing on electricity production data within the supply chain inventory domain.
- Utilized Python to perform essential tasks, such as data cleaning, anomaly detection, and modeling techniques, on the client's data. This effort resulted in the identification of short-term inventory trends and accurate forecasting for a solar energy supply chain initiative.
- Optimized SQL queries and conducted A/B testing using Python Statistics Tableau, and Power BI dashboards. These tools were instrumental in meeting business requirements, offering actionable insights for decision-making, and visualizing data to uncover trends.
- Utilized state-of-art custom machine learning classification algorithms to enhance workflows and scalability, ultimately reducing losses in supply inventory forecasting algorithms.
- Held responsibility for the complete end-to-end AI/ML model pipeline and deployment. This encompassed problem definition, data collection and analysis, engineering top-correlated features, and monitoring model performance.
- Implemented advanced Time series forecasting(time and date) and monitoring techniques to identify trends, measure success, and facilitate ongoing enhancements in product performance.
- Nurtured close collaboration with global teams spanning the US, Canada, and Sweden. This collaboration played a pivotal role in steering well-informed product strategies and investment decisions.
- Crafted data reports and visualizations that effectively communicated KPI findings and future recommendations to stakeholders, using data storytelling techniques to enhance comprehension.
"Experience is the best teacher."
Academic Projects
"Optimizing Logistics Efficiency in Stride" project is a comprehensive initiative that utilizes advanced analytics and data-driven strategies to enhance Stride Logistics' operational efficiency. The project is structured into three key phases, each contributing to the overall success of the endeavor.
Phase 1: Exploratory Data Analysis
During this phase, the project team conducts a thorough assessment of the dataset. They perform data integrity checks, delve into both numerical and categorical attributes, and uncover intricate relationships between variables. These insights reveal crucial trends and patterns that serve as a foundation for informed decision-making.
Phase 2: Feature Engineering, Correlation Analysis, and Machine Learning Modeling
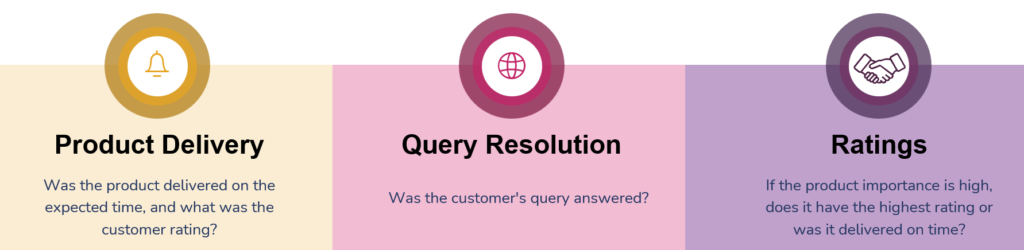
In this phase, the project leverages domain knowledge to introduce new features to the dataset. By scrutinizing correlations between these features and the target variable (delivery time), the team identifies the most influential features. Diverse machine learning models, including Naive Bayes, Logistic Regression, K-Nearest Neighbours (KNN), Support Vector Machine (SVM), Decision Tree, Random Forest, and XGBOOST, are evaluated rigorously. The analysis extends to relationships among factors such as shipping mode, product importance, and timely deliveries, generating actionable recommendations for operational enhancement.
Phase 3: Application Development
This phase involves the creation of a Python Flask web application to facilitate user interaction. The application enables users to upload their own data, which undergoes analytical and machine learning processes. The results encompass exploratory data analysis insights, machine learning model outcomes, accuracy metrics, and strategic recommendations for present and future scenarios.
The project's pivotal outcomes encompass:
Exploratory Data Analysis: Insights are derived from both numerical and categorical attributes, unveiling distribution patterns, delivery trends, and correlations between elements like shipping mode, product importance, and customer behavior.
Feature Engineering: A total of 20 novel features are engineered, encompassing encoded values, interaction terms, categorizations, and computed metrics. These features significantly contribute to the precision of predictive models.
Machine Learning Models: The project employs a range of machine learning algorithms to predict delivery performance, including Naive Bayes, Logistic Regression, K-Nearest Neighbours (KNN), Support Vector Machine (SVM), Decision Tree, Random Forest, and XGBOOST. These models not only forecast performance but also provide strategic recommendations.
Application Development: The Python Flask web application empowers users to apply project insights to their own data, yielding actionable insights and recommendations for improved operational efficiency and customer satisfaction.
Recommendations: Informed by rigorous analysis and modeling, the project generates actionable recommendations that hold the potential to elevate operational efficiency, customer satisfaction, and overall logistics performance.
Overall, the "Optimizing Logistics Efficiency in Stride" project effectively harnesses advanced analytics tools and techniques to furnish actionable insights and recommendations that elevate Stride Logistics' operations and customer contentment.
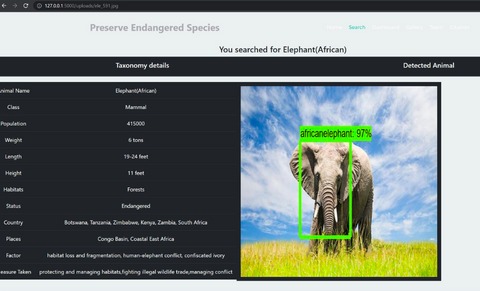
The "Endangered Species Detection, Prevention Measures, and Global Level of Data Visualization" initiative is a comprehensive machine learning project that aims to detect and mitigate the extinction risk facing endangered species. The project leverages advanced computer vision techniques to identify endangered species from images and videos while providing vital insights into their population trends and habitats. Additionally, the project explores a spectrum of strategies designed to shield these vulnerable species from further endangerment.
Key components of the project encompass:
Dataset: A diverse collection of images showcasing various endangered species, including African elephants, lions, arctic foxes, cheetahs, pandas, chimpanzees, panthers, and rhinos, is utilized. The dataset is meticulously curated from sources such as wildlife conservation organizations and online repositories. To enhance diversity and balance, images are subject to editing through software like Adobe and Picasa.
Data Preprocessing: To ready the dataset for machine learning training, a series of preprocessing steps are undertaken. These include standardizing image dimensions through resizing, expanding the dataset through data augmentation, and optimizing pixel values using data normalization. Image labeling is executed in accordance with the PascalVOC format, facilitated by the LabelImg toolkit.
Machine Learning Model: Employing a Faster Region-based Convolutional Neural Network (Faster-RCNN), the project trains the model on the preprocessed dataset. The Faster-RCNN model proves optimal for its remarkable speed and accuracy compared to its predecessors. To enhance its performance, the model undergoes optimization techniques such as hyperparameter tuning and regularization. Notably, NVIDIA's CUDA toolkit is harnessed to attain high-performance training on local systems.
Prevention Measures: Beyond species identification, the project ventures into proactive strategies to thwart further species endangerment. These encompass habitat conservation, educational efforts surrounding wildlife conservation, and advocacy for policy changes. The project outlines feasible implementation methods for these measures and assesses their potential impact.
Global Level Data Visualization: A pivotal facet of the project lies in the provision of global-level data visualizations. These visuals, presented in formats including maps, graphs, and charts, elucidate species population trends, habitat distribution, and conservation endeavors. The visualizations are meticulously crafted using Google Looker Studio.
Installation: The project necessitates the installation of key dependencies like TensorFlow, Keras, NumPy, Pandas, and Flask. A comprehensive installation guide, including the utilization of a recommended requirements.txt file, is provided to facilitate smooth implementation.
Project Workflow: The workflow unfolds in several stages: users upload images to the Flask server, which subsequently leverages the ML model for species identification. The results are then showcased through data visualization reports, offering insights into both detected species and the depletion of species.
Conclusion: In summation, the "Endangered Species Detection and Prevention Measures" project contributes significantly to the preservation of endangered species. By harnessing the power of machine learning, it detects species, furnishes insights into their status, advocates protective strategies, and employs global data visualization to steer conservation efforts and policy decisions. This holistic approach reflects a remarkable stride towards ensuring the longevity of endangered species in a technology-empowered era.

This analysis delves into Spotify's dataset, utilizing machine learning to predict song likability. With data on 170,000+ songs, incorporating features like danceability, energy, and valence, the primary objective is to construct accurate prediction models.
Introduction:
Introduction of Spotify's data wealth and its relevance for predicting likability based on audio features.
Dataset Description:
Explanation of key features: danceability, energy, valence, etc., along with the binary likability target.
Exploratory Data Analysis:
Visualizations, histograms, correlation matrices aid in comprehending feature distributions and relationships.
Highlighted insight: Shorter songs tend to garner more likes. Positive correlation between danceability and likability.
Feature Engineering:
Importance of feature engineering in enhancing model effectiveness.
Transformation of less meaningful features, e.g., song duration in milliseconds to minutes.
Findings:
Significance of song duration's impact on likability.
Creation of a "mood" variable based on valence, energy, and tempo.
Genre identification through KMeans clustering.
Predictive Models:
Application and evaluation of four models:
Logistic Regression: Utilizes scikit-learn's default hyperparameters.
Random Forest: Combines decision trees to combat overfitting.
XGBoost: Scalable algorithm using the xgboost library.
Neural Network: Incorporates a simple architecture with ReLU activation.
Model Evaluation:
Dataset split into training and test sets for model evaluation.
Accuracy scores on the test set:
Logistic Regression: 84.74%
Random Forest: 79.66%
XGBoost: 84.74%
Neural Network: 77.96%
Conclusion:
XGBoost and Logistic Regression exhibit strong performance, achieving an 85% accuracy.
Implications for music platforms like Spotify in delivering tailored recommendations.
Acknowledgment of Deep Learning's reduced significance due to dataset limitations.
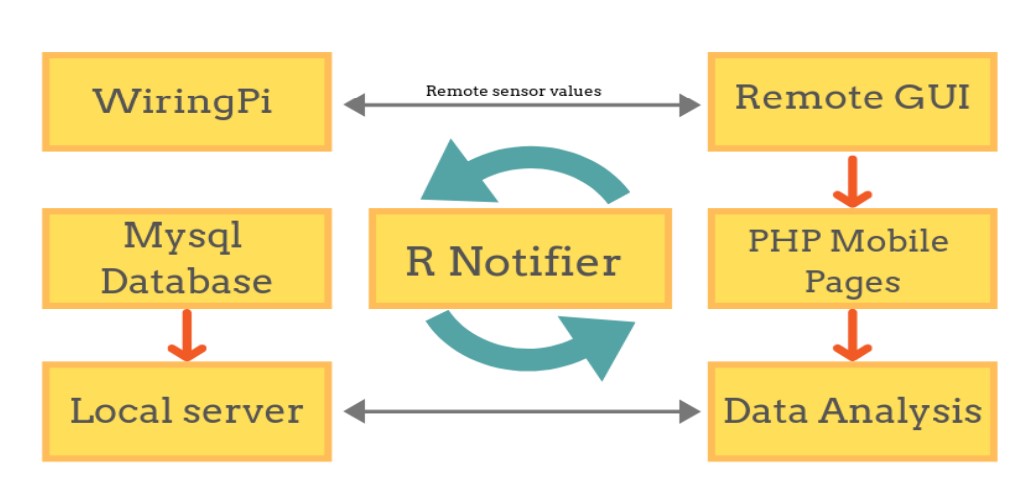
The R-Notifier, a brainchild of a dedicated team from MGM's Jawaharlal Nehru Engineering College in Aurangabad, Maharashtra, represents a groundbreaking wireless calling system revolutionizing customer service in the restaurant industry. It effectively addresses the common challenge of waitstaff unavailability during busy periods by employing an intuitive remote and receiver system, ensuring swift and seamless communication between staff and customers.
Functionality and Implementation: The R-Notifier consists of a user-friendly remote featuring "CALL" and "CANCEL" buttons, strategically placed on each restaurant table. When patrons press the "CALL" button, a unique wireless code is transmitted to a central receiver. This receiver incorporates LED lights that illuminate, promptly displaying the relevant table number requiring assistance. The project's brilliance lies in its combination of innovative hardware and a well-designed web-based user interface.
Data Analytics for Enhanced Efficiency: One of the remarkable aspects of the R-Notifier is its integration of data analytics. The system collects valuable data on customer requests, response times, and waiter interactions. This data is then processed and analyzed to generate insights into daily sales patterns, peak hours, and order preferences. By leveraging this data, restaurant managers can make informed decisions to optimize staff allocation, menu offerings, and overall operational efficiency.
Seamless Order Management: The system includes a dedicated Android app that empowers waitstaff to manage orders with ease. Once a request is made, orders are swiftly transmitted to the kitchen staff via a chef panel, streamlining food preparation processes. This interconnectedness ensures orders are processed efficiently, reducing wait times and enhancing the overall dining experience.
Advantages and Future Scope: The R-Notifier system transcends conventional service systems by incorporating data-driven insights. This empowers restaurants to proactively address customer needs, improve service quality, and adapt to evolving demands. Beyond restaurants, the system's adaptability makes it viable for a range of industries, from hospitals to shopping malls, where customer service excellence is paramount.
Conclusion: The R-Notifier, an ingenious wireless calling system, propels customer service excellence in restaurants to new heights. By combining technological innovation, user-friendly design, and data analytics capabilities, the project not only addresses common challenges but also enhances operational efficiency. Its success story is a testament to the team's dedication, engineering acumen, and commitment to delivering practical solutions that transform traditional industries.
References: The project is inspired by a blend of research articles on wireless communication systems, data analytics, and related technologies.


Have a new project ?
Reach me at [email protected]
I'm open to suggestion and very flexible when it comes to digital photography and branding design. Have a talk with me.
trusted clients
Happy clients trusted Billey
Certifications
This certification represents my expertise in python, R, data analysis, visualization, and utilizing tools like SQL and Google Analytics. Looking forward to leveraging these skills for data-driven decision-making.
This certification represents my expertise in applying advanced programming skills, build models using deep learning or artificial intelligence, and leverage the power of data analysis technologies
This certification represents my expertise in Machine Learning, R (Programming Language), Microsoft Power BI and Logistic Regression in Microsoft Excel.